The right information when you need it
The right information when you need it
-
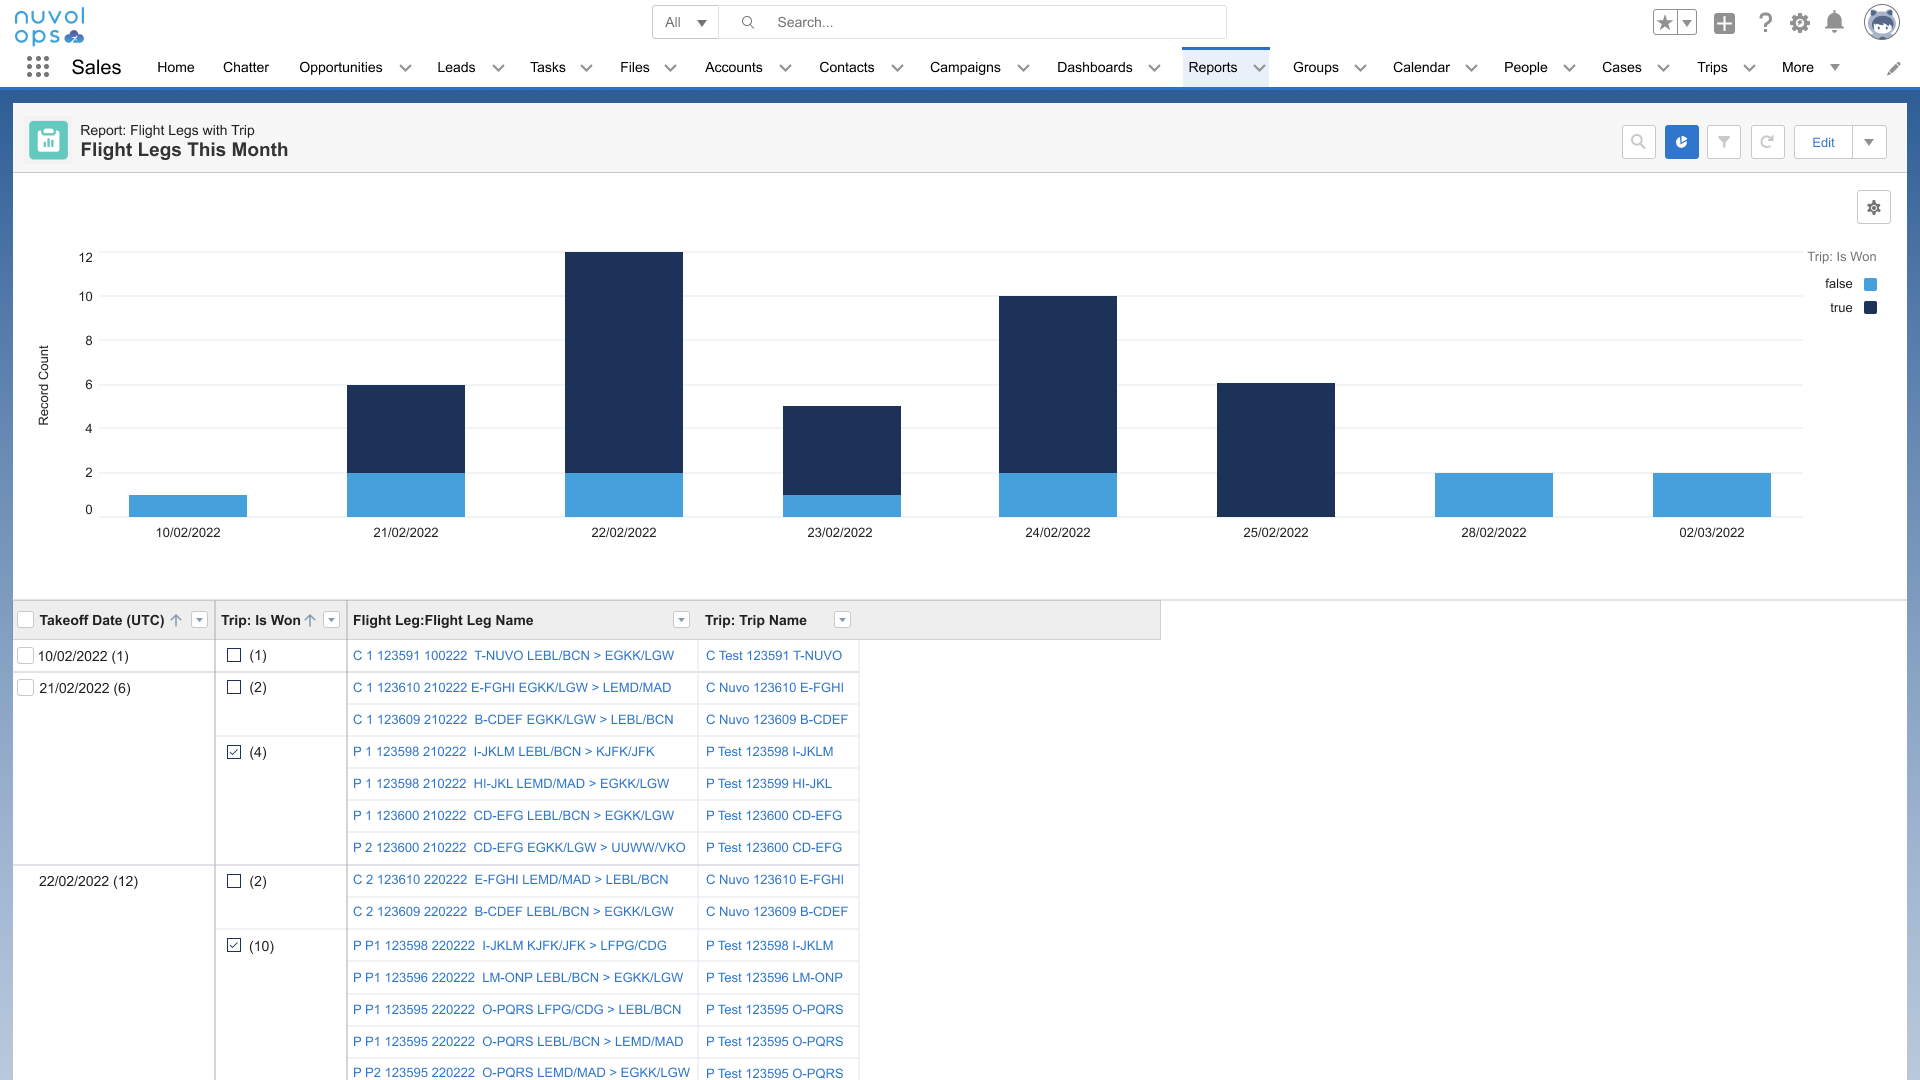
Create and customize key reports and dashboards
Reporting on any of your operational data and representing it in charts is easily done. Take the charts and add them to your favorite dashboard and see exactly how your department is doing. Reports and Dashboards can also be viewed while on the go with the NuvolOps mobile solutions.
-
Easily share your insights with your team
Reports and Dashboards are shared effortlessly with your colleagues using our communication and collaboration tools. Once shared, they will then be able to open and view the reports or dashboards whenever required with the latest information. If you prefer to simply export the reports, we provide for that as well.